


 Latest Financials
Condensed Interim Financial Statements For the six months and full year ended 31 December 2025
Financials Archive![]() Note: Files are in Adobe (PDF) format.
Note: Files are in Adobe (PDF) format.
Please download the free Adobe Acrobat Reader to view these documents.
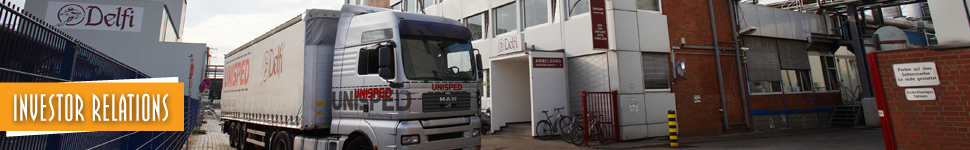
Condensed Interim Consolidated Income Statement
Note:
(1) The increase pertains to the disposal of some property assets, divestment of supply commitments and foreign exchange gain recorded.
(2) EBITDA is earnings before taxes, interest, depreciation and amortisation.
(3) Diluted earnings per share for 6 months and 12 months ended 31 December 2025 and 2024 are the same as basic earnings per share
as there were no potentially dilutive ordinary shares.
NM - Not meaningful.
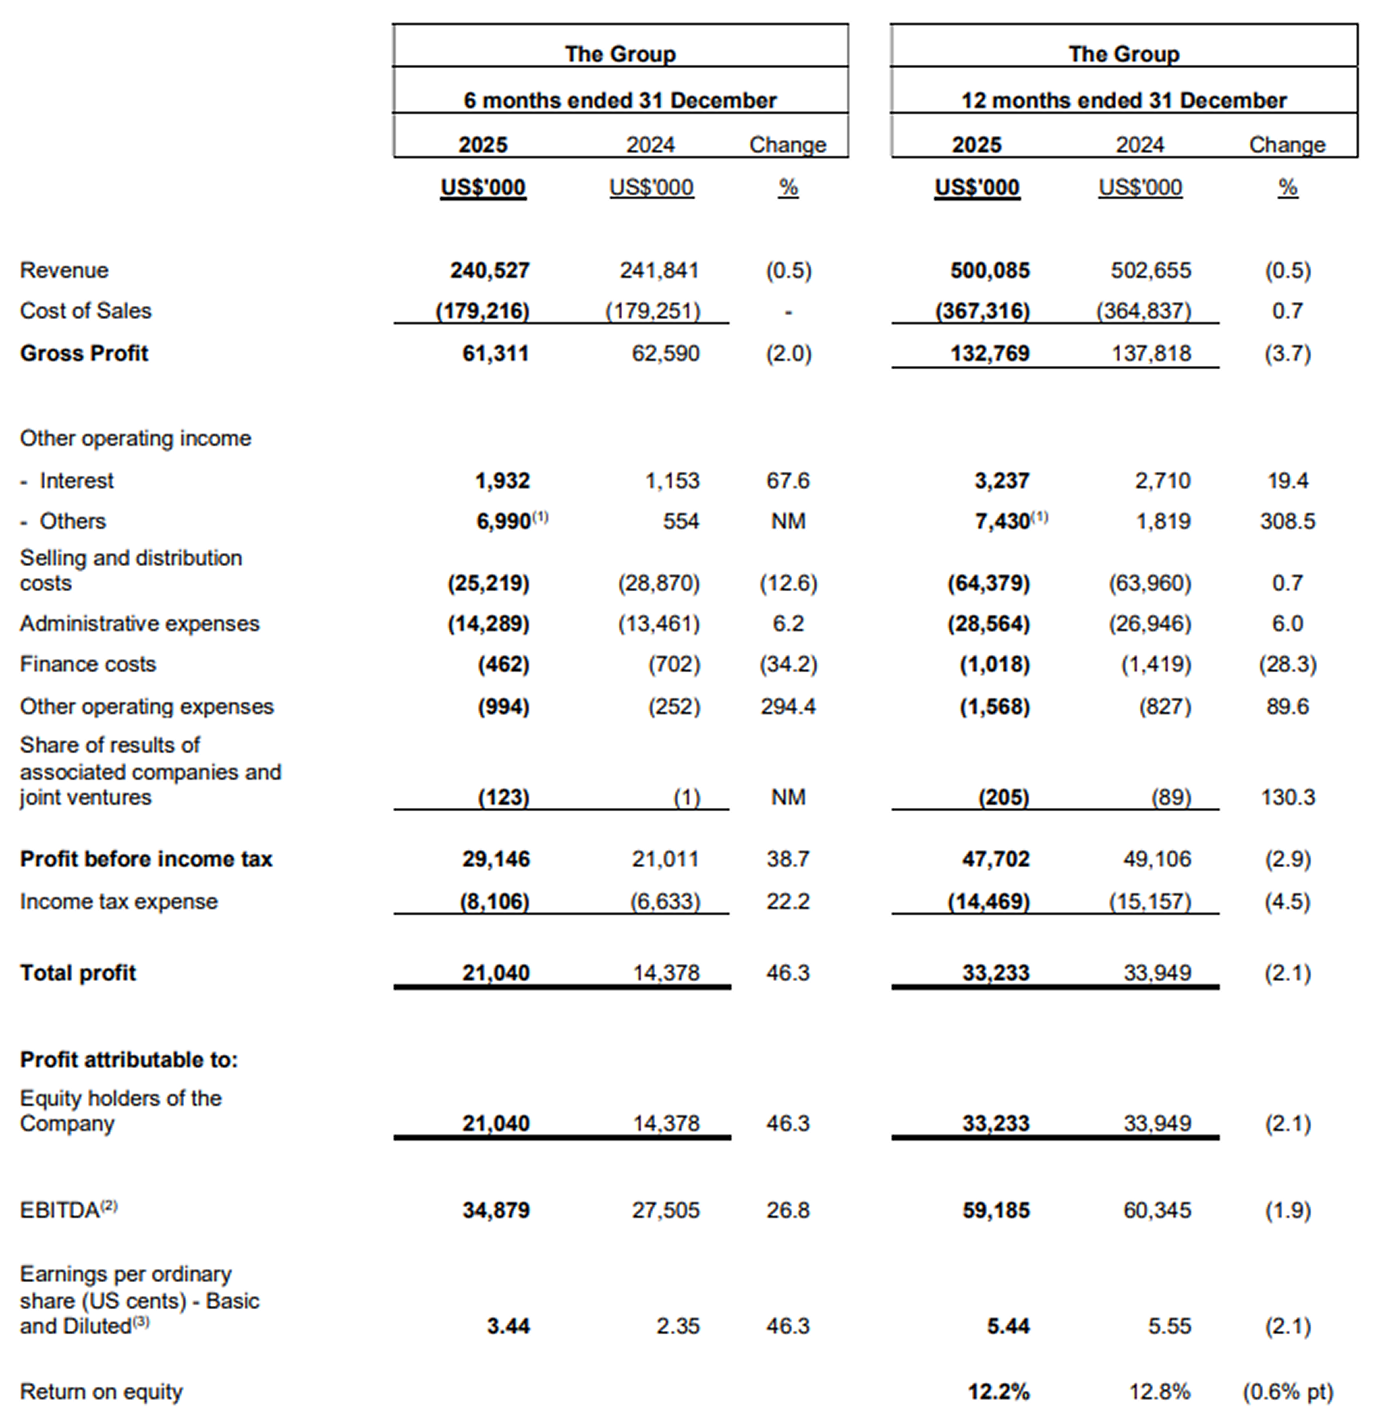
Condensed Interim Consolidated Statement Of Comprehensive Income
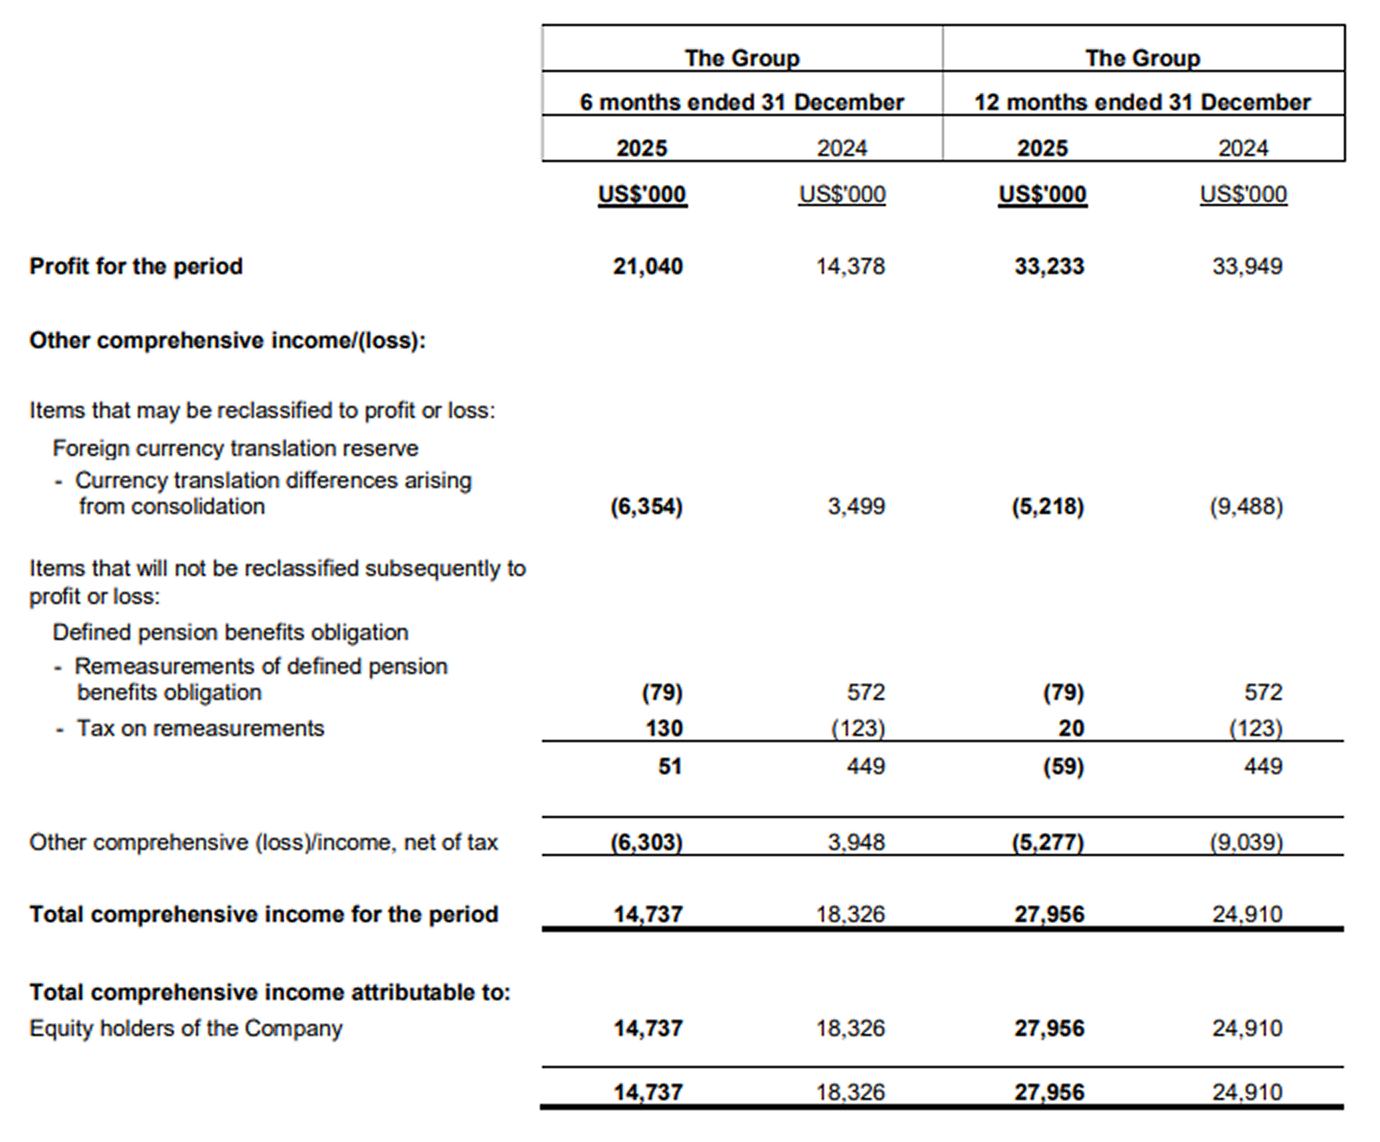
Condensed Interim Balance Sheets
Review of Performance of the Group
Key Figures for the Group (unaudited)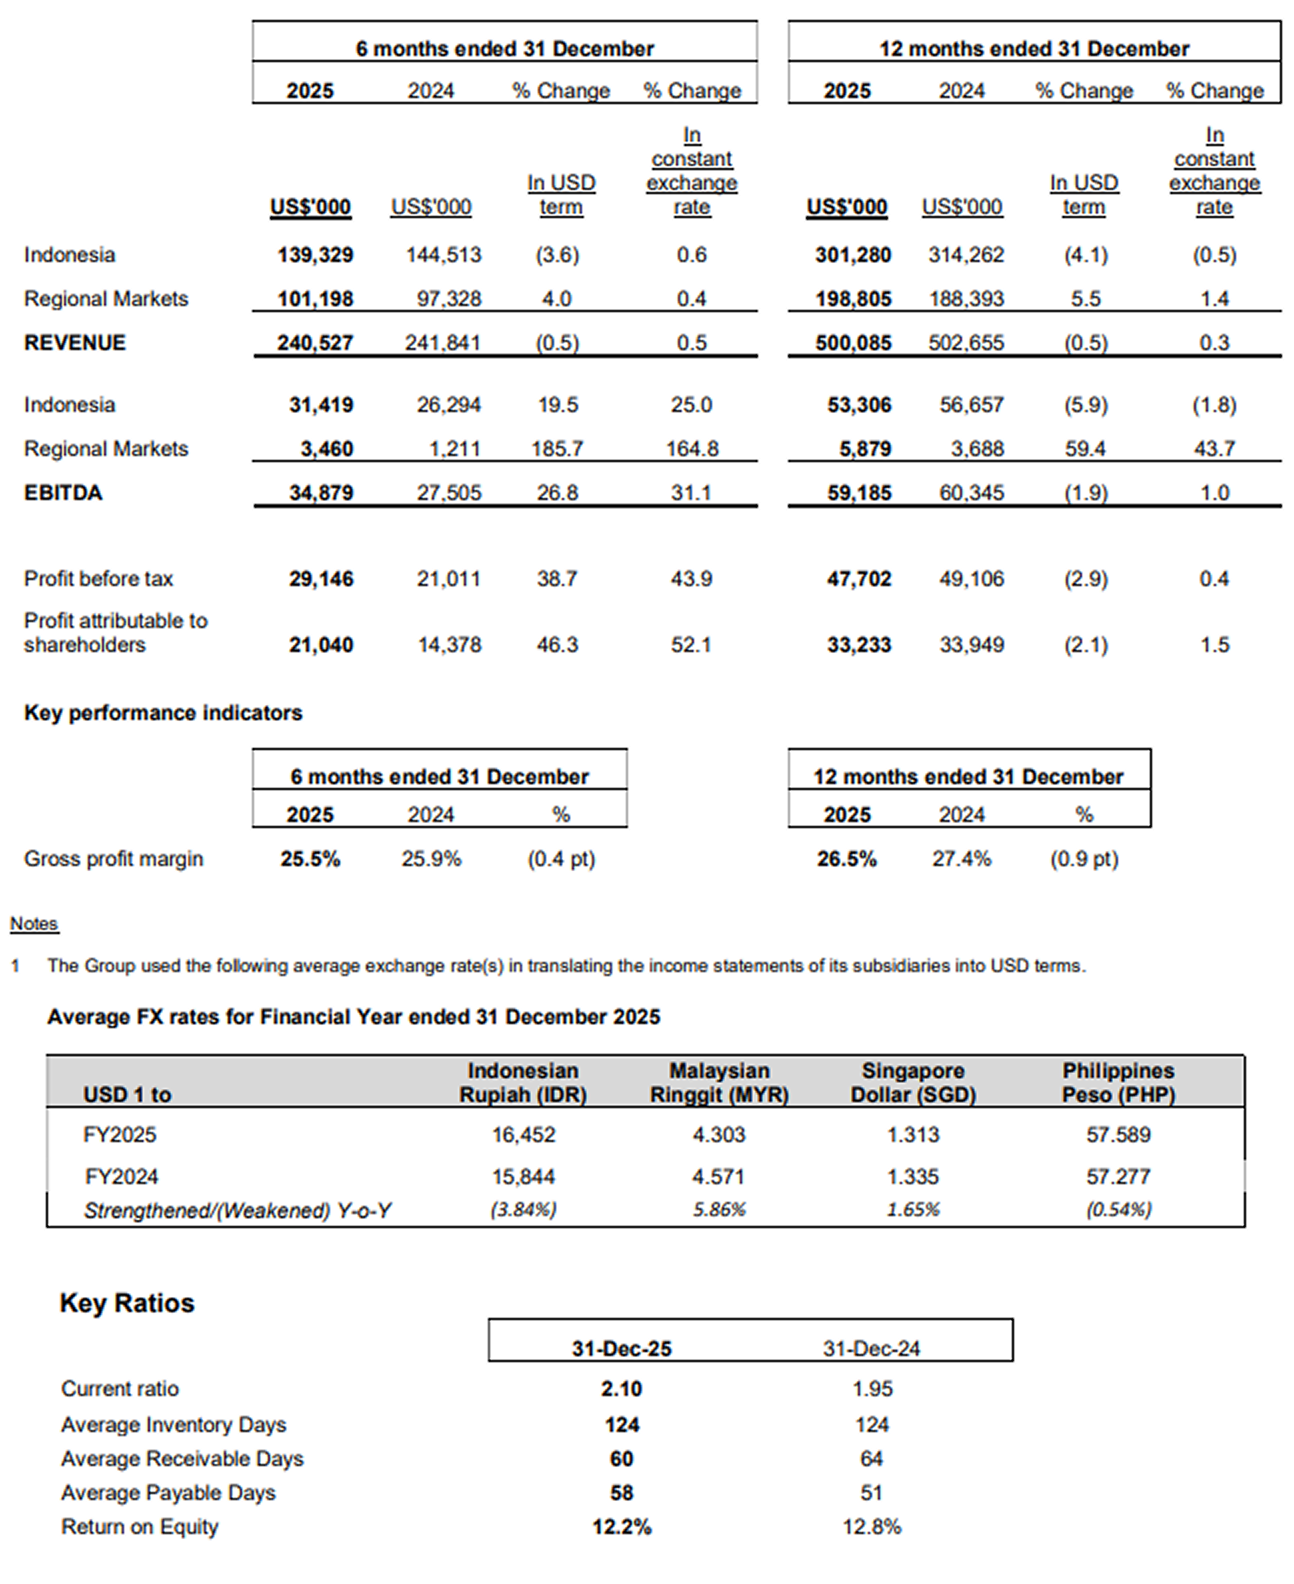
Review of the Group's 2H and FY2025 Financial Performance
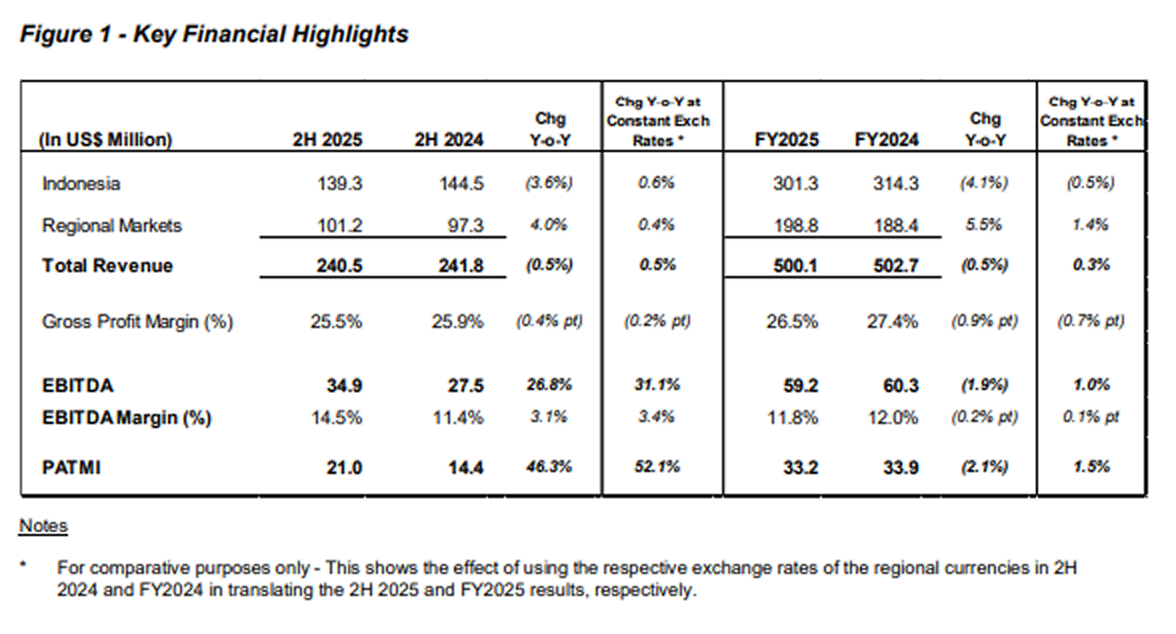
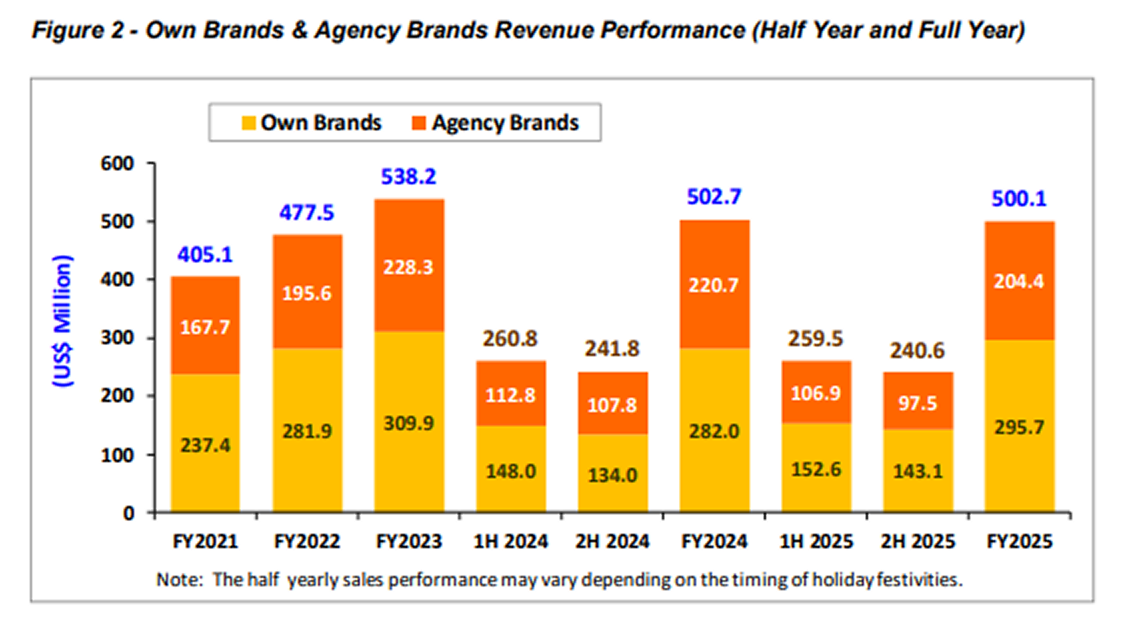
Despite a challenging macroeconomic climate marked by uncertain trade flows and high cocoa prices throughout most of 2025, the Group's full year consolidated Net Sales on a US Dollar basis decreased 0.5% Year-on-Year (Y-o-Y) to US$500.1 million. This represents a 0.3% increase on a constant currency basis. Growth was driven by strong performance in Own Brands, particularly in Indonesia, which helped offset a decline in Agency Brands resulting from our termination of one of our Agency Brands. Excluding the impact of this termination, consolidated Net Sales would have increased by 6.2% Y-o-Y.
Consequently, the Group reported a full-year PATMI of US$33.2 million, a 2.1% Y-o-Y decline in our US Dollar reporting currency. On a constant currency basis, full-year PATMI would have increased by 1.5% Y-o-Y.
The following key factors contributed to the Group's performance:
- Strong Own Brands Performance - Own Brands maintained strong momentum through strategic promotional investments aimed at driving long-term growth and countering competition. This momentum carried through the second half of 2025, during which Own Brands sales increased 6.8% Y-o-Y. For the full year, consolidated Net Sales for Own Brands grew 4.9% Y-o-Y, or US$13.7 million. On a constant currency basis, this growth would have reached 7.9%.
- Agency Brands Performance - The strong performance in Own Brands helped offset a 7.4% decline in consolidated Agency Brands Net Sales. The decrease in Agency Brands was primarily due to lower sales in Indonesia resulting from reduced promotional spending by certain agencies early in the year, followed by our termination of one of our Agency Brands. These declines were only partially mitigated by growth in Regional Markets.
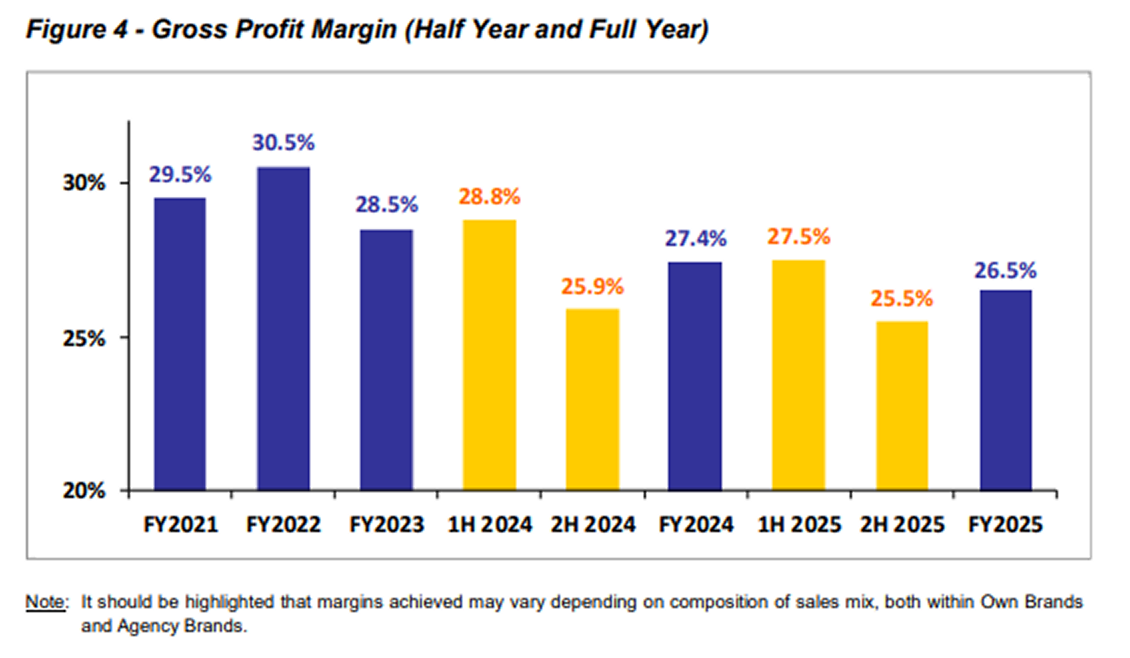
- Weaker Currency - A 3.8% depreciation of the Indonesian Rupiah against the US Dollar, together with higher promotional spending for core brands and lower margins from Agency Brands, contributed to a 90 basis points (bps) decline in our Gross Profit Margin compared with the prior year.
The Group generated net cash from operating activities of US$78.2 million in FY2025, a Yo-Y increase of US$25.6 million, mainly from continued disciplined working capital management. The cash generated was primarily utilised to fund the Group’s capital expenditure programme for investing mainly in capacity expansion and equipment replacement. As at 31 December 2025, our cash balance stood at US$68.0 million.
The Board is proposing a final dividend of 1.72 US cents/share (2.15 Singapore cents/share). Taken together with the interim dividend of 1.00 US cents/share (1.28 Singapore cents/share), that was paid on 12 September 2025, total 2025 dividends will be 2.72 US cents/share (3.43 Singapore cents/share). If the final dividend is approved by shareholders at our upcoming Annual General Meeting on 28 April 2026, it will be payable on 15 May 2026.
Performance Review by Markets
Indonesia
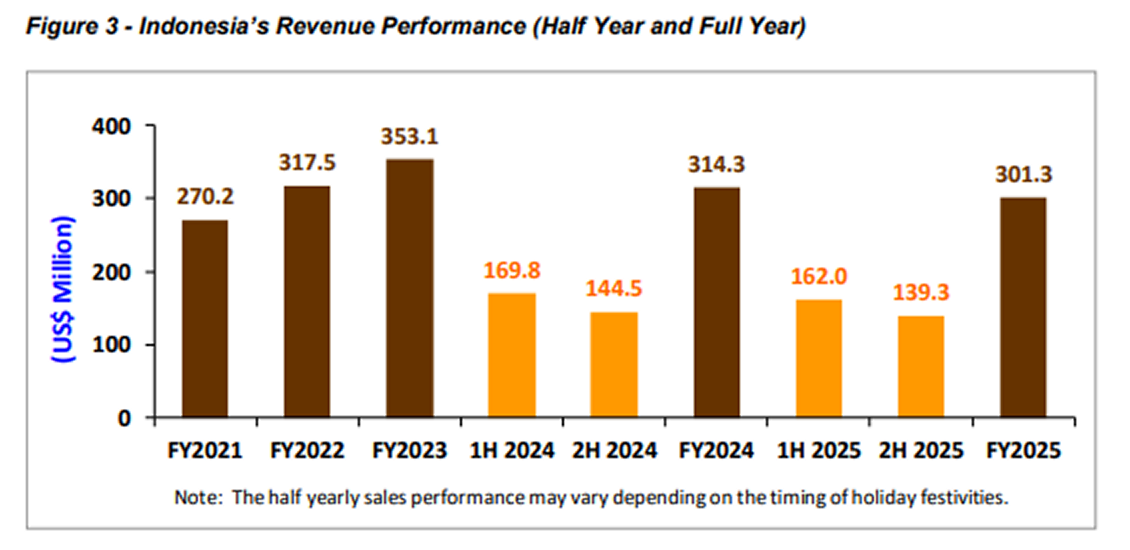
For FY2025, Net Sales in Indonesia were US$301.3 million, reflecting a 4.1% Y-o-Y decline. This decrease can be attributed to a 26.9% Y-o-Y drop in Agency Brands due to the weaker performance in certain agency accounts. However, this was almost completely offset by a 5.3% Y-o-Y increase in Own Brands, with higher strategic promotional investments supporting long-term brand growth and addressing competitive market dynamics.
The Regional Markets
For Regional Markets, Net Sales for FY2025 totalled US$198.8 million, reflecting a 5.5% increase compared to FY2024. The increase was primarily driven by growth in Own Brands and Agency Brands in Malaysia.
Review of Profitability
The Group recorded an overall Gross Profit Margin (“GPM”) of 25.5% in 2H 2025 (a Y-o-Y decrease of 0.4% points). For the full year however, the GPM decreased Y-o-Y by 0.9% points to 26.5%. This marginal decline was primarily driven by the depreciation of the Indonesian Rupiah against the US Dollar (which was lower by close to 4% Y-o-Y), increased promotional spending, and lower margins from Agency Brands.
Reported EBITDA for 2H 2025 rose 26.8% Y-o-Y to US$34.9 million, expanding the EBITDA margin by 310 basis points to 14.5%. On a sequential basis, 2H 2025 EBITDA improved by US$10.6 million over 1H 2025, representing a 510 basis point margin increase. For FY2025, reported EBITDA at US$59.2 million, a Y-o-Y decrease of 1.9%, however the EBITDA margin declined only marginally by 20 basis points.
Full year EBITDA performance primarily reflects lower Net Sales, the slight compression in the GPM, and marginally higher operating costs.
Review of Financial Position and Cash Flow
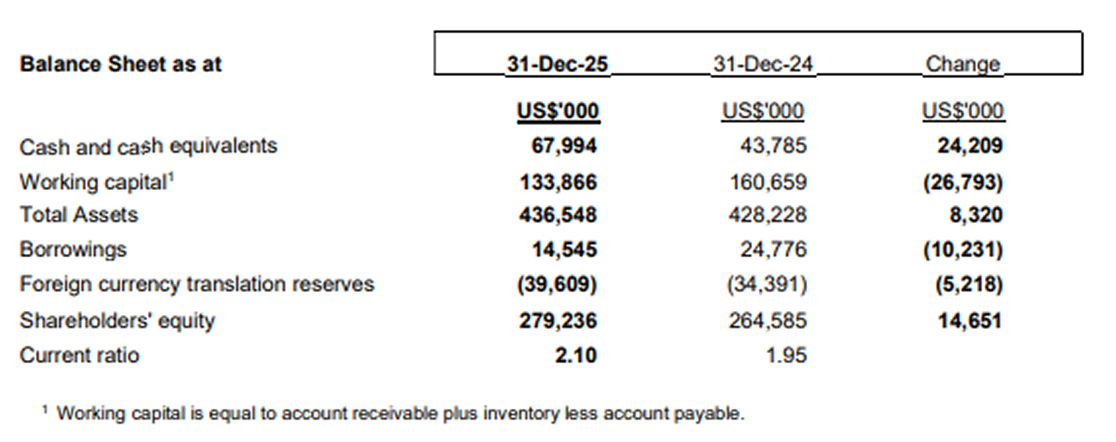
During the year, the Group maintained a disciplined approach to working capital management, generating US$78.2 million in net cash from operating activities, a Y-o-Y increase of US$25.6 million. Working capital requirements for FY2025 totalled US$133.9 million a reduction of US$26.8 million compared to end-2024. This improvement was mainly attributable to a US$14.9 million reduction in inventories, and tight control of trade receivables and payables.
In light of persistent inflationary pressures and regional supply chain challenges, we remain committed to closely monitoring inventory levels to ensure a steady supply of raw materials, ingredients, and other inputs while maintaining strict working capital management discipline.
Of the cash generated from operations during the year, US$9.2 million was utilised for capital expenditures and advances for purchase of property, plant and equipment, while US$10.2 million was applied toward repaying borrowings. We continue to monitor capital expenditures closely in line with prevailing market conditions adjusting as necessary.
As at 31 December 2025, the Group’s cash and bank deposits stood at US$68.0 million. The Group’s strong balance sheet continues to provide significant resilience against potential uncertainties that may arise.
Total assets at year-end 2025 reached US$436.5 million, an increase of US$8.3 million compared to year-end 2024, driven primarily by the higher cash balance and partially offset by lower inventories. Shareholders’ equity increased by US$14.7 million, supported by higher retained earnings, which were partially offset by an unfavourable movement in the foreign currency translation reserve.
Commentary
The global cocoa market has weakened from previous peaks due to expected supply recovery. However, this transition is taking place alongside an increasingly uncertain macroeconomic landscape in Indonesia, our primary market. Consequently, we are very focused on maintaining a high level of situational awareness, to stay agile and to adjust our operations as needed to support our growth objectives in Indonesia.
To capture the region's expanding opportunities, in 2026 we will strategically focus on reinforcing our market leadership through continued investment in core brands and product innovation to broaden consumer appeal. We are also strengthening our routes-to-market capabilities by expanding our geographical reach and enhancing our sales organisation to improve our position at the retail shelf. By combining these growth drivers with strict financial discipline and a focus on operational efficiency, we remain confident in our ability to adapt our strategies and deliver sustainable value.